This example assumes that you have set up a TreeTop project with the relevant metrics and have linked it to an Excel workbook.
The workbook used in this example contains a worksheet that calculates three metrics for a new development under consideration. These metrics are
- Revenue
- Total Costs
- Net Present Value

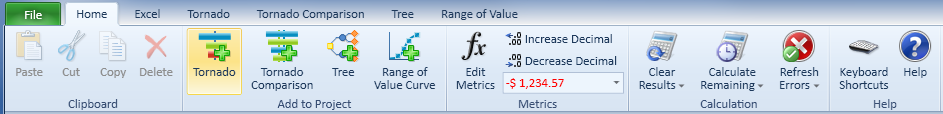
Click on the Tornado button, which is located in der Add to Project section on the Home ribbon tab.
A new Tornado diagram is added as a new project tab.
Hint: You can rename the Tornado document by double-clicking on the tab at the bottom.
Hooking up the Metrics
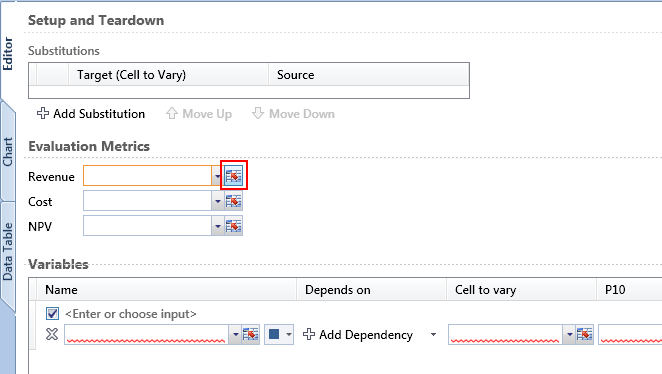
Begin by telling TreeTop which cells will contain the results that are to be used for the Tornado diagram.
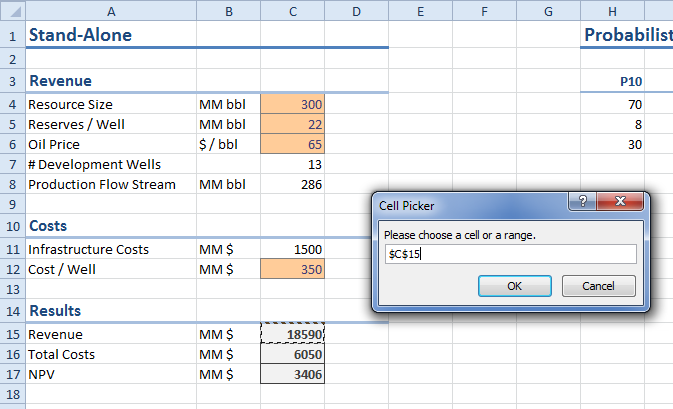
For each metric in turn, click on the Cell Picker icon at the right of the cell editor.
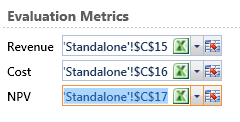
This will activate the underlying Excel workbook. Select the cell containing the result corresponding to the metric and choose Ok in Excel.
Repeat this for all metrics.
Adding Variables
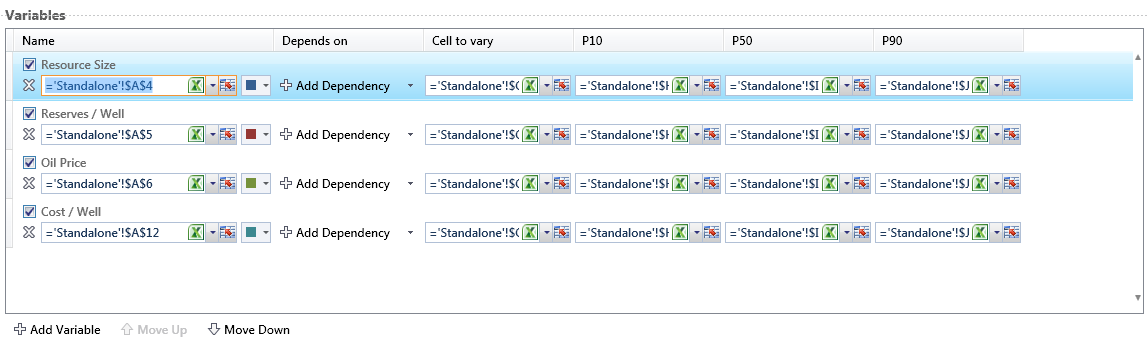
TreeTop allows you to add variables individually by clicking on the Add Variable button at the bottom of the screen for each variable.
You then
- either manually enter a name, or choose a cell reference
- change the color, if you do not like the default for the bar
- pick a cell to vary
- either manually enter P10 / P50 / P90 input values, or choose a cell reference
For this example we will use an advanced feature of TreeTop to populate the variables.
Instead of adding variables manually, we will point TreeTop at the range that continues all the input variables and the modify that selection.
Click on the cell picker for the Name of the variable and select the entire range that contains the inputs for the Tornado.
In this example, the range A4:J12 contains the inputs.
After selecting that range, TreeTop will prompt you with the Tornado Autofill Wizard.
In this wizard make sure that the Name, Cell to Vary, Low, Base and High columns have been correctly identified.
If the wizard has chosen a worng column, select the drop-down below the column indicator of the correct column and adjust the selection.
The area that we have supplied contains more data than just input variables.
Uncheck the rows that do not contain an input variable. In the example, we want
- Resource Size
- Reserves / Well
- Oil Price
- Cost / Well
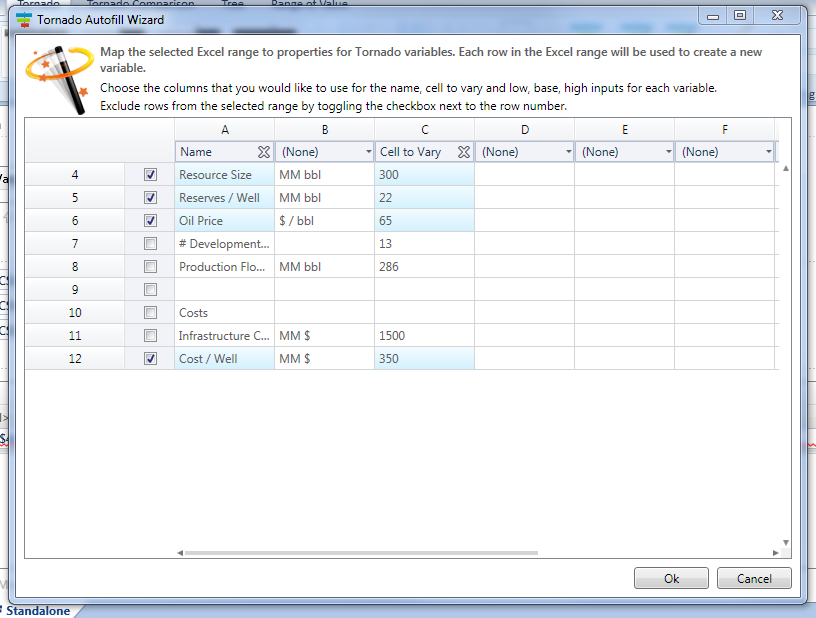
After making the adjustments in the wizard, click Ok.
TreeTop uses this information to create the four variables for us that we require and discards the rest of the range that we selected.
Viewing the Chart
All required information that TreeTop requires for the creating of a Tornado diagram has now been supplied. Click on the Chart tab to look at the resulting diagram and on the Data Table tab to see the calculated data in detail.

Looking at the chart for Revenue, you see that Cost / Well does not impact revenue - the variance is 0%. Resource Size has by far the largest impact on revenue.
You can use the metric drop down located in the bottom right of the application to view a different metric - Revenue, Cost or NPV in this example.
Navigate
Next
Basic Tornado Diagram FeaturesTornado Comparison Reference
IntroductionBuilding Your First Tornado Diagram
Basic Tornado Diagram Features
Advanced Tornado Diagram Features
Data Table
Calculation of Tornado Diagrams
Other Resources
Introduction to Tornado ComparisonsTreeTop Application
Table of Contents