Many aspects of the Tornado Comparison diagram can be customized to suit individual preferences and needs.
The controls to change the diagram and bar appearance are located on the Tornado Comparison ribbon tab.
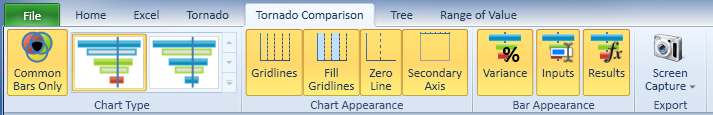
Common Bars Only
Toggle this setting to display only bars that are contained in each tornado that is part of the comparison, or to display all variables - even if they are not part of every strategy.
Whether all variables or only common variables convey a better picture depends on the problem.
Generally, when there are many variables that are not common to all strategies, the Color by Strategy chart view often works better.
The Tornado Comparison View Modes topic outlines the differences between Color by Variable and Color by Strategy in more detail.
Chart Appearance Settings
These settings allow you to manipulate the overall chart appearance, such as the display of gridlines and various axes (Zero Line, Secondary Axis).
A chart that looks very busy due to a large number of strategies and thus variables often benefits from the removal of visual artifacts, such as grid lines.
Bar Apperance Settings
Detailed information for each variable (Variance, Inputs, Results) can be toggled on or off using these buttons.
The variance is displayed in the legend on the left side of the chart, whereas inputs and results are displayed next to each bar.
A chart that looks very busy due to a large number of strategies and thus variables often benefits from the removal of visual artifacts, such as inputs and results.
Screen Capture - Exporting the Chart
Click on the Screen Capture drop down button to display the available screen capturing options.
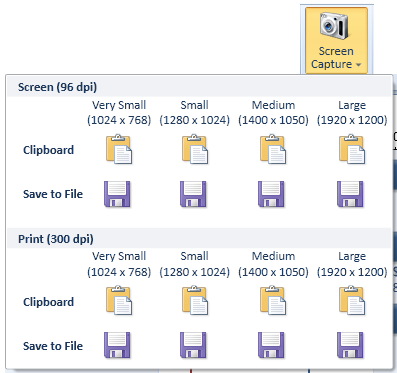
You can export the chart at various resolutions (96 dpi and 300 dpi), a variety of sizes (1024 x 768 up to 1920 x 1200) either to a file or to the clipboard.
You should choose the resolution and size that best fits your output medium.
Print resolutions are much larger than screen resolutions, but work well for screen presentations too. If you intend to use the same chart for printing and screen presentation, use a print resolution for best results.
The size of the image is best chosen if you know the resolution of the display device, such as a projector beforehand. If you do not know the resolution of the display device, or if a presentation will be
used on multiple devices, a resolution of 1280x1024 or 1400 x 1050 usually works well.
If you screen capture to the clipboard, switch to the application where you intend to use the image, such as your presentation software application, and use the Paste option in that application
to insert the screen capture.
Alternatively capture to a file and open the file from the presentation software package.
Navigate
Next
Working With the SidebarTornado Comparison Reference
IntroductionBuilding Your First Tornado Comparison
Basic Display Options
Working With the Sidebar
Tornado Comparison View Modes
Data Table
Report and Insights
Other Resources
Introduction to Tornado DiagramsTreeTop Application
Table of Contents