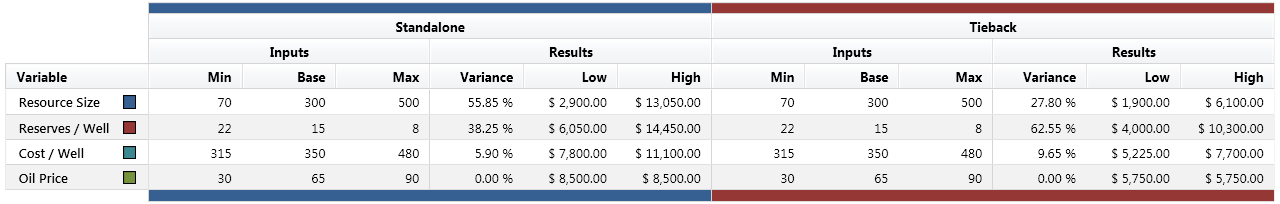
The data table tab presents the underlying data for each variable of each Tornado that underlies the Tornado Comparison.
Change the metric in the bottom right of the application window to view the data table for a different metric.
Use the Screen Capture drop down to export a captured image of the data table for presentation purposes.
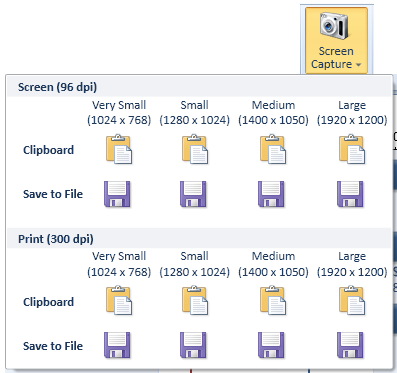
You can export the data table at various resolutions (96 dpi and 300 dpi), a variety of sizes (1024 x 768 up to 1920 x 1200) either to a file or to the clipboard.
You should choose the resolution and size that best fits your output medium.
Print resolutions are much larger than screen resolutions, but work well for screen presentations too. If you intend to use the same data table for printing and screen presentation, use a print resolution for best results.
The size of the image is best chosen if you know the resolution of the display device, such as a projector beforehand. If you do not know the resolution of the display device, or if a presentation will be
used on multiple devices, a resolution of 1280x1024 or 1400 x 1050 usually works well.
If you screen capture to the clipboard, switch to the application where you intend to use the image, such as your presentation software application, and use the Paste option in that application
to insert the screen capture.
Alternatively capture to a file and open the file from the presentation software package.
Navigate
Next
Report and InsightsTornado Comparison Reference
IntroductionBuilding Your First Tornado Comparison
Basic Display Options
Working With the Sidebar
Tornado Comparison View Modes
Data Table
Report and Insights
Other Resources
Introduction to Tornado DiagramsTreeTop Application
Table of Contents